
DFW Airport shattered the high temperature record for April 8, 2020. The high temperature of 97°F breaks the old record high of 93°F set in 1991.

In addition, the low temperature this morning, April 9, 2020, was 71°F breaking the old low maximum temperature of 70°F set in 2001.
Author Archives: dfwwea5
SIGNIFICANT SEVERE WEATHER POSSIBLE TODAY WITH TORNADOES
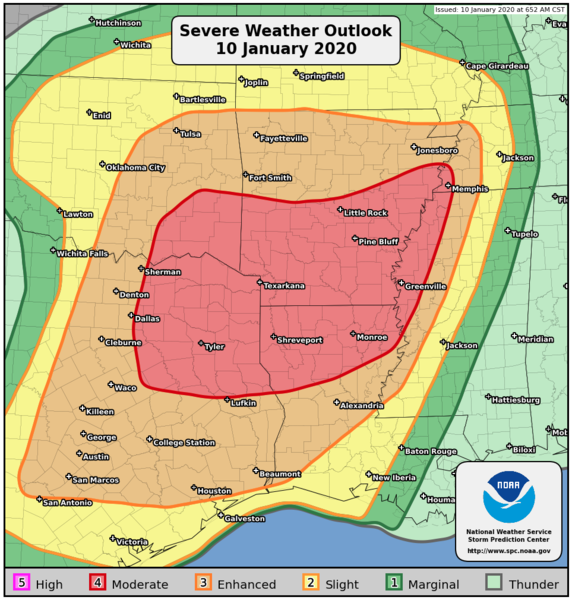
WHAT: The atmospheric ingredients are coming together for a potential significant severe weather event today, and possibly a significant tornado outbreak across the area. All modes of severe weather are possible, including tornadoes, hail to the size of baseballs, and damaging straight-line winds. The Storm Prediction Center has placed part of the area in a Moderate Risk category for severe weather, the rest of the area in an Enhanced Risk category. The potential for strong and violent tornadoes also does exist in this type of setup. If a tornado warning is issued for your area, please heed the warning.
WHEN: Today between Noon and 9pm
WHERE: The entire forecast area.
RECORD COLD CLOSES OUT OCTOBER 2019 AT DFW
The coldest Halloween in 26 years just occurred at DFW. It was 1993 when we had a cold blast of similar magnitude to the one that just happened. In fact, the cold blast of 1993 was actually a little colder and produced snow flurries on the 29th. On Halloween 1993, we reached a low of 29°F. This year we missed that record by one degree with the low on Halloween reaching 30°F. We tied the record low of 31°F set in 1906 for November 1st. 2019 was only one of five years where we had back-to-back consecutive freezes so early in the season. Other years with back-to-back freezes so early in the season include, 1913, 1925, 1957, 1993, and 2019. October 2019 ended up being 2 degrees below normal for the month. This joins the myriad of cooler than normal months of 2019, with September 2019 being the notable exception because it was the hottest September on record.
WE FALL BACK ONE HOUR THIS SUNDAY, NOVEMBER 3, 2019
Just a reminder that we fall back one hour at 2:00 am, Sunday, November 3, 2019. Central Daylight-Savings Time (CDT) ends and we begin Central Standard Time (CST). Remember to set your clocks back one hour.
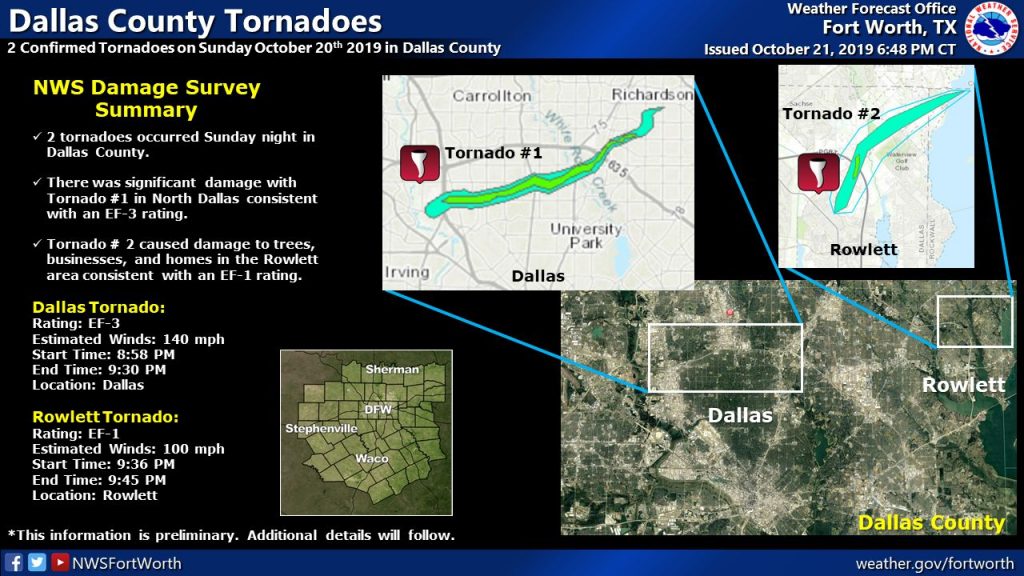
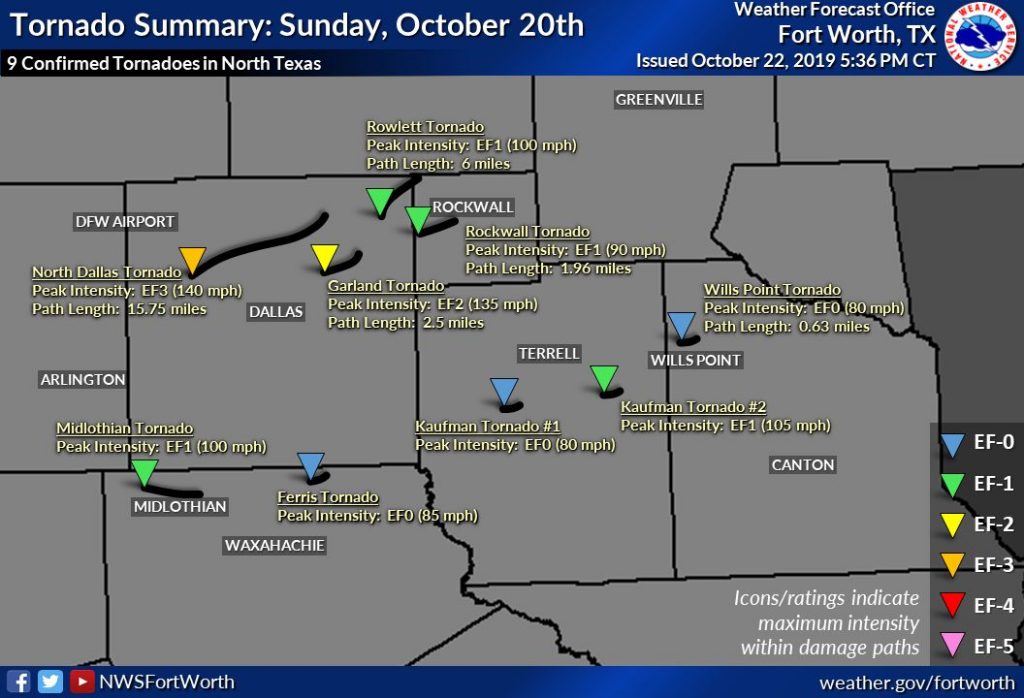
9 CONFIRMED TORNADOES HIT THE METROPLEX LAST SUNDAY, OCTOBER 20, 2019
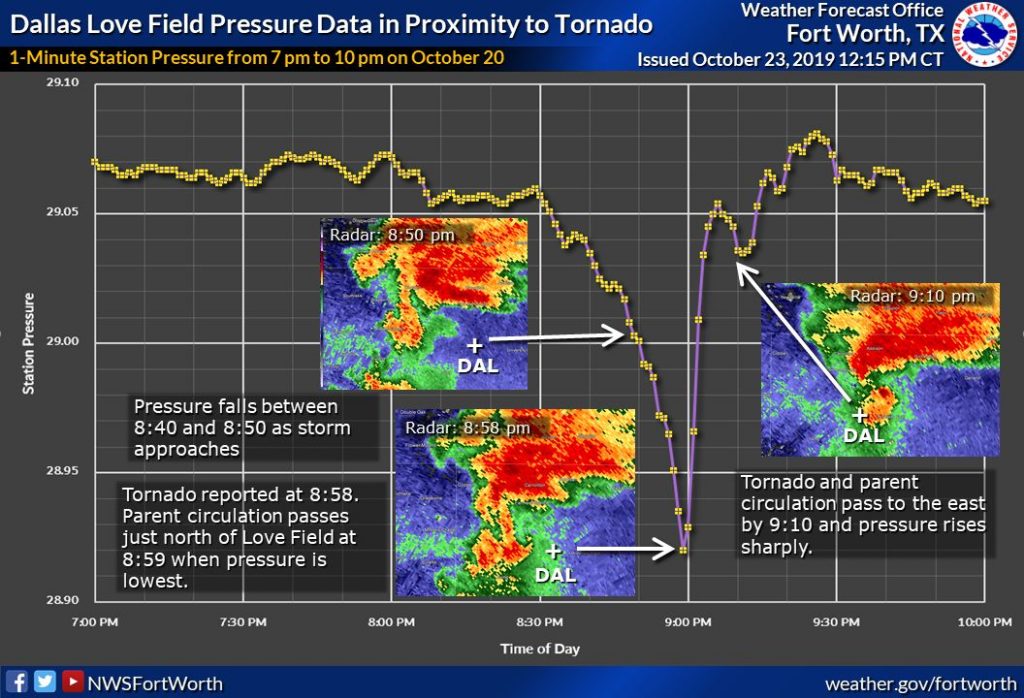
The National Weather Service office in Fort Worth has confirmed that 9 tornadoes hit the Metroplex last Sunday, October 20, 2019. The strongest and most devastating of which was the Dallas Tornado:
- Rating: EF-3
- Winds: 140 mph
- Start Time: 8:58pm
- End Time: 9:30pm
- Track: 15.75 miles
Other tornadoes touched down in Rowlett, Midlothian, Ferris, 2 in Kaufman County, Garland, Rockwall, and Wills Point. The one that hit Dallas was among the strongest to ever hit the city of Dallas. Below are preliminary results and graphics from the National Weather Service.
DFW SETS A RECORD HIGH TEMPERATURE YESTERDAY, OCTOBER 6TH
A record high temperature of 97°F was set at DFW Airport
yesterday, October 6th. This breaks the old record of 96°F set in 1956.
SEPTEMBER 2019 THE HOTTEST AND DRIEST ON RECORD FOR DFW
September 2019 is the hottest and driest on record for DFW as officially recorded at DFW Airport. Records date all the way back to September 1898 (121 years). The average temperature for September 2019 was 86°F. The normal average temperature for September should be around 78°F. We had the most 95°F and 90°F days than any September on record (23 and 29 days respectively). This is the only September where no low temperature below 70°F was recorded. To put that in perspective, 60% of Septembers should see at least one low temp below 60°F with about 25% seeing a low of 50°F or below. When the low temperature stays 60°F or above, that is a bit of a benchmark for a warm September.
Additionally, September 2019 is the only September on record not recording any measurable rainfall, making it the driest on record. What a difference a year makes! September 2018 was the wettest on record for DFW where 12.69 inches of rain fell.
Below are the top 5 hottest and coldest Septembers for DFW and their respective average temperatures.
HOTTEST:
- 2019 – 86°F
- 2005 – 84°F
- 1939 – 84°F
- 1998 – 84°F
- 2015 – 83°F
COLDEST:
- 1974 – 71°F
- 1902 – 73°F
- 1918 – 73°F
- 1913 – 73°F
- 1935 – 74°F
DFW REACHES 100°F OFFICIALLY FOR THE FIRST TIME THIS SUMMER SEASON
Yesterday, July 30, 2019, the high temperature hit 100°F. This marks the first official 100 degree day for the 2019 summer season at DFW. By no means a record late first 100 degree day (that is in Septemeber), but it is quite rare for us to go all of June and most of July without hitting 100°F. There are only two years on record where we did not hit 100°F at all, that is the summers of 1906 and 1973.
RECORD DAILY RAINFALL AT DFW YESTERDAY
DFW Airport recorded 2.42 inches of rain on Sunday, June 16, 2019. This breaks the old record of rain for that date
of 1.32 inches which was previously set in 1968.DFW SETS A RECORD LOW MAX TEMPERATURE YESTERDAY
The high temperature yesterday, May 10, 2019, at DFW Airport was 57°F. This
breaks the record for the lowest maximum temperature for May 10th of 63°F
previously set in 1954.